Amid the unfolding energy transformation, the symbiotic relationship between solar power and energy storage becomes apparent. Worldwide, the realm of solar energy coupled with energy storage is undergoing a phase of rapid expansion. Beyond the facets of elevated electricity costs and supportive policies, numerous European and American nations enjoy exceptional solar resources, rendering their solar and energy storage endeavors increasingly economically viable. With overseas solar and energy storage companies unveiling their semi-annual data, a discernible trend emerges—demand for solar and energy storage continues to surge, signifying an unwavering appetite for this tandem.
SolarEdge: Q2 Witnesses the Continued Growth of Volume and Gains
Based on SolarEdge’s latest semi-annual report, their performance in the first half of 2023 is striking. The company’s revenue surged to $1.935 billion, marking an impressive 40% year-on-year growth. Even more noteworthy is their net profit, which soared by a staggering 435%, reaching $258 million.
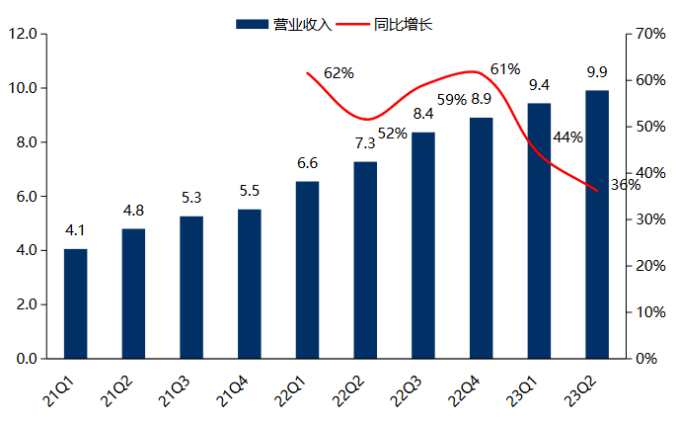
Breaking it down further, their revenue for Q2 hit a substantial $991 million, reflecting a robust 36% year-on-year expansion. Notably, the company's gross margin achieved 32.0%, signifying a notable 6.9% increase compared to the previous year. Within the PV segment, encompassing inverters and optimizers, the gross margin reached 34.7%, exhibiting a remarkable 6.6% year-on-year rise.
Anticipating the third quarter of 2023, SolarEdge predicts a gross margin range of 30% to 33% within the PV segment. This projection marks a growth of 1.7% to 4.7% compared to the previous year. This enhancement is primarily attributed to heightened shipments of three-phase industrial and commercial inverters, which were initially projected to have lower gross margins. Additionally, the heightened shipments of inverters compared to optimizers also played a role in the upswing.
SolarEdge’s single-quarter revenue and year-on-year growth rate (Unit;$billion, %)
Blue stands for revenue while red line for YoY Growth (Data source: Companies' Announcement and Guoxin Securities)

Regarding the PV segment, the recent report reveals that the company’s revenue for this category in Q2 of 2023 amounted to $947 million, marking an impressive 38% year-on-year growth. Forecasts indicate that in Q3, the revenue within the PV segment is projected to fall within the range of $850-880 million, reflecting a year-on-year increase of 8% to 12%. This surge can be attributed to a blend of factors, including the effects of a milder winter, the easing of energy supply challenges, and a reduction in electricity prices. Furthermore, the lower-than-anticipated European industrial and commercial installations at the start of the year have also contributed to this trend.
Shifting focus to energy storage batteries, Q2 of 2023 witnessed the company’s energy storage shipments reaching 259MWh, signifying a 7% increase compared to the previous year. However, projections for Q3 suggest a significant drop in energy storage shipments compared to Q2, primarily due to the anticipated buildup of high inventory levels in Europe.
Turning to SMA, their semi-annual report unveils a steady growth in revenue, leading the company to revise its full-year guidance.
Over the first half of 2023, the company accomplished a revenue of 779 million euros, showcasing an impressive 65% year-on-year expansion. Furthermore, they achieved an EBITDA of 103 million euros, marking an extraordinary year-on-year growth of 1076%.
In the second quarter of 2023, the company achieved the revenue of 412 million euros, marking an impressive 64% year-on-year growth. Concurrently, the gross margin reached 29.3%, a significant 9.3% increase compared to the previous year. This uptick can be primarily attributed to several factors, including enhanced raw material supply, a reduction in associated fixed production costs, and a shift toward a more favorable high-margin product mix. Moreover, SMA has taken substantial strides by revising its full-year revenue guidance, elevating it from the initial range of EUR 1.45-1.60 billion to a new span of EUR 1.70-1.85 billion. Correspondingly, their EBITDA guidance has also been bolstered, ascending from EUR 135-175 million to an elevated range of EUR 230-270 million. Furthermore, a 20% year-on-year sales growth objective has been set for the year 2024.
SMA’s quarterly Revenue and year-on-year growth rate (€billion, %)
(Dark blue stands for household storage, light blue for industrial and commercial storage, light purple for ground-based power plant and red line for YoY growth rate.)

SMA Net profit and year-on-year growth Rate in H1 and Q2 2023 (€billion, %)

As of the close of Q2 2023, SMA maintains a robust order backlog, although the pace of growth has moderated. This deceleration can be attributed primarily to the company’s enhanced capability to swiftly deliver products. At the current juncture, SMA’s order value has surged to EUR 2.076 billion, representing an impressive year-on-year escalation of 141%. Presently, the company’s supply chain infrastructure has been finely tuned, facilitating a delivery capacity that meets the market’s demands for residential, industrial, and commercial products. In the current landscape, orders for residential and industrial-commercial categories encompass a sales lead time of 6 to 8 months (as opposed to the standard 3 months), whereas ground power plant orders extend over a sales lead time of 12 months (compared to the standard 6 months).
Overseas optical storage rigid demand is obvious, in the steady development stage
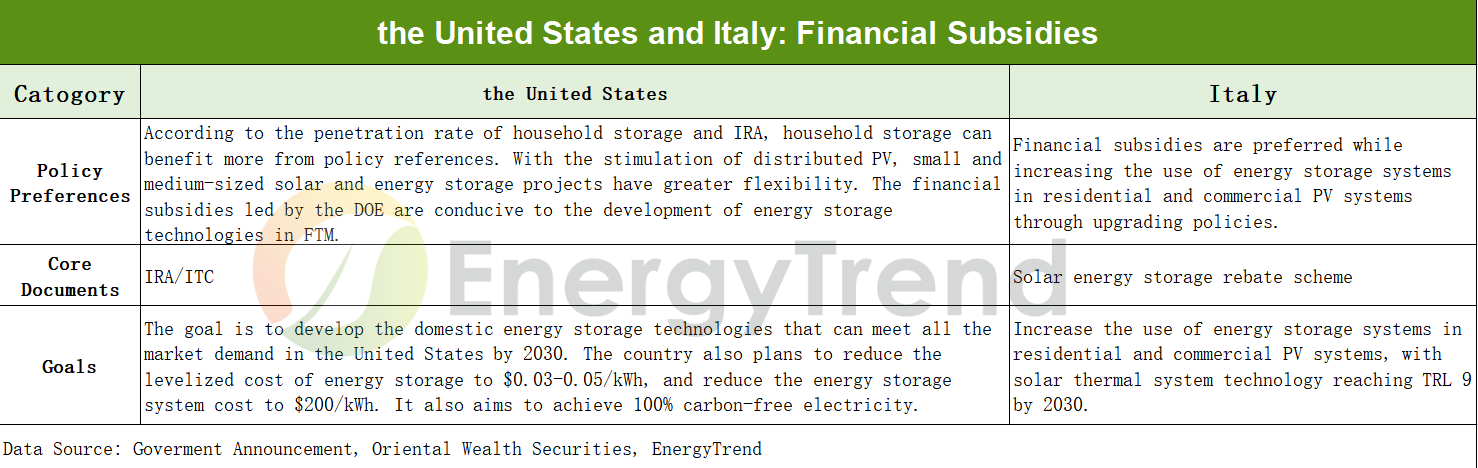
The global optical storage market has entered a period of rapid growth, looking at overseas optical storage policy, the major countries have to legislation, the introduction of financial subsidies, tax incentives, management-oriented policies to promote the development of photovoltaic and energy storage, but the direction of the policy varies.
Differences in Energy Storage Policies in Different Countries


Presently, there exists a robust demand within the global residential storage market; however, the persistent issue of exorbitant labor expenses remains. As per industry experts, within the battery system domain, top-tier European and American companies’ factory prices range from 3 to 4 yuan per Wh, while second-tier companies fall within the 1.5 to 2 yuan per Wh bracket, taxes included. Turning to energy storage systems, Tesla’s Powerwall commands an average selling price of 90,000 yuan per unit in the United States (inclusive of Power Conversion System and battery). Furthermore, due to scarcities in labor availability and the concurrent escalation of labor costs, installation expenses contribute to around 23% of the total cost of an energy storage system in developed nations.
Nevertheless, the United States and European nations have taken substantial strides by introducing an array of policies and strategies. These encompass tax incentives, subsidies, and self-consumption initiatives, all aimed at incentivizing homeowners to embrace photovoltaic and energy storage systems. This drive is directed at augmenting the prevalence of self-installation and self-consumption, ultimately curtailing electricity expenses. The overseas market is witnessing a surge in demand, underscored by these favorable policies. Furthermore, local enterprises are constrained in their ability to swiftly curtail production and manufacturing costs. These circumstances collectively give rise to a propitious juncture for domestic energy storage firms to seize upon international opportunities.